Table
Creates a table for your tabular content.
- To present tabular information with a clear, repeating structure.
- To help users scan structured data to make informed decisions.
- To create layouts—use a layout or related component.
- For simple, non-tabular information—use a list.
- When you have fewer sections and want to emphasize each more—use a card.
- For choices about pricing—use a pricing table.
Released | Released | n/a | n/a | Released |

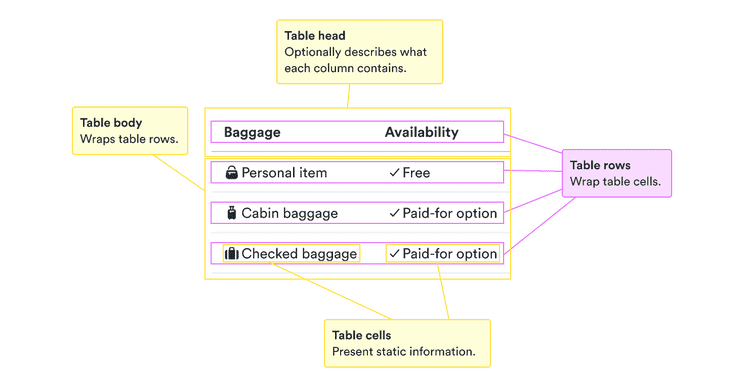
Tables are great at presenting a clear structure that can be scanned to get just the right information. Make sure to use all of the benefits this structure offers.
This means not just taking advantage of the visual differences in rows,
but making it clear what headers are connected to what data.
Use <th> elements and scope
to make it clear to everyone what the table means.
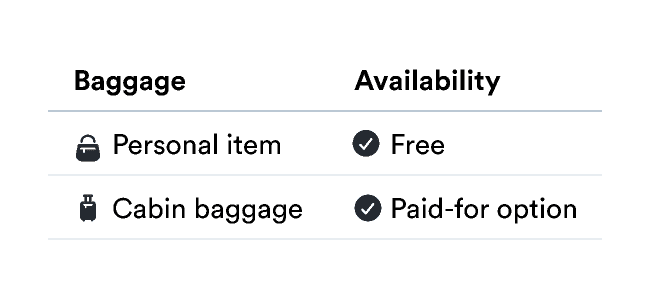
Tables are great for presenting information with a clear, repeating structure. Breaking structured data into tables helps users scan it for what they need.
While tables have long been used for layouts on the web, it’s not what they’re best at. Use components like cards, stack, and grid to get the layout you want.
Tables are useful for scanning for the right information. Users get slowed down in scanning if there’s too much information at once.
Keep the data short, especially in headers. Use only one or two words when possible to communicate the essence of what the table contains.

Do
Keep headers short.

Don't
Don’t include details in the headers.
To quickly scan data, it helps if it’s all presented in the same way. Keep your data aligned in the same way throughout the table so users don’t get confused about where the information is.
When you have tables with multiple columns, sometimes it can be hard to match rows to exact columns. That’s why rows in Orbit tables have a CloudNormal background when they’re hovered over.
This darker background makes the data easier to scan to match the correct row and column.
Tables have options for both the row backgrounds (whether or not to be striped) and the text color.